In the realm of modern software development and deployment, few technologies have had as profound an impact as Kubernetes. Originally developed by Google and later open-sourced, Kubernetes has revolutionized the way applications are built, deployed, and managed in today’s cloud-native landscape. In this comprehensive guide, we’ll delve into what Kubernetes is, why it’s important, and […]
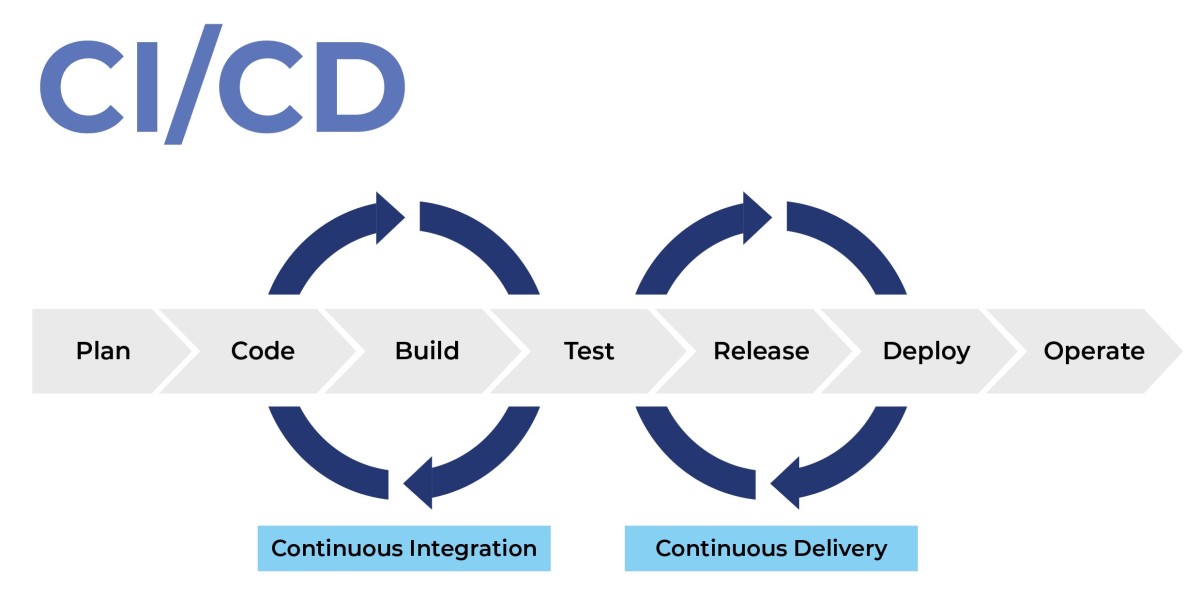
In today’s fast-paced software development landscape, the ability to deliver high-quality applications quickly and efficiently is paramount. Continuous Integration (CI) and Continuous Deployment (CD) have emerged as essential practices for achieving this goal. In this article, we’ll explore what CI/CD is, why it’s important, and how you can implement it in your development workflows to […]

In the realm of software development, version control is a fundamental practice that enables teams to collaborate effectively, track changes, and manage codebase evolution. Whether you’re working on a solo project or part of a large development team, understanding version control is essential for maintaining code quality, facilitating collaboration, and ensuring project success. In this […]
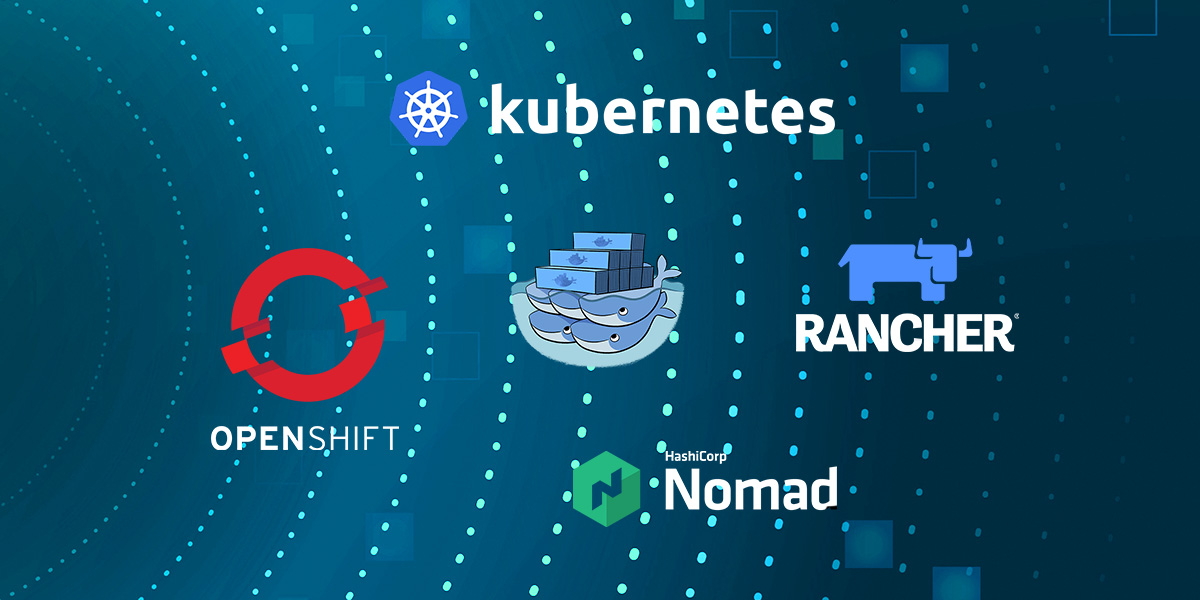
In the dynamic world of modern software development, container orchestration has emerged as a critical component for managing and scaling distributed applications with ease and efficiency. In this article, we’ll delve into what container orchestration is, why it’s important, and how it can revolutionize your deployment workflows. Understanding Container Orchestration At its core, container orchestration […]
In the realm of information technology, virtualization has emerged as a game-changing technology that revolutionizes the way we deploy, manage, and scale IT infrastructure. In this article, we’ll explore what virtualization is, why it’s important, and how it can empower organizations to optimize their resources, improve flexibility, and streamline operations. Understanding Virtualization At its core, […]
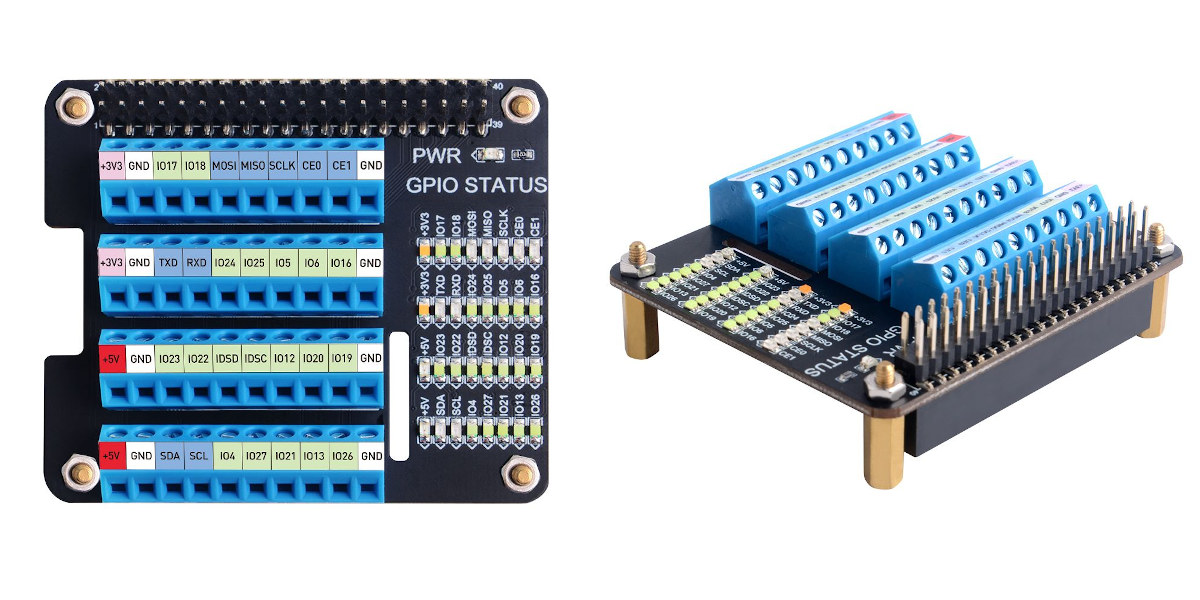
Since version 4.8 the Linux kernel has a new interface based on character devices for accessing and managing GPIO lines in user space. Linux kernel GPIO interface GPIO stands for General-Purpose Input/Output and is one of the most commonly used peripherals in an embedded Linux system. Internally, the Linux kernel implements the access to GPIOs […]
A few days ago I decided to reverse engineer my router’s firmware image with binwalk. I’ve bought the TP-Link Archer C7 home router. Not one of the best, but good enough for my needs. One thing I always do when I buy a new router is install OpenWRT. Why? Because the manufacturer’s firmware quality is […]

This article is going to be an introduction to embedded Linux security. Since this topic is quite extensive, I divided into two parts. In this first part, we will have a small introduction to security concepts and threat modeling and then focus on some mitigation techniques to improve the security of an embedded Linux device, […]
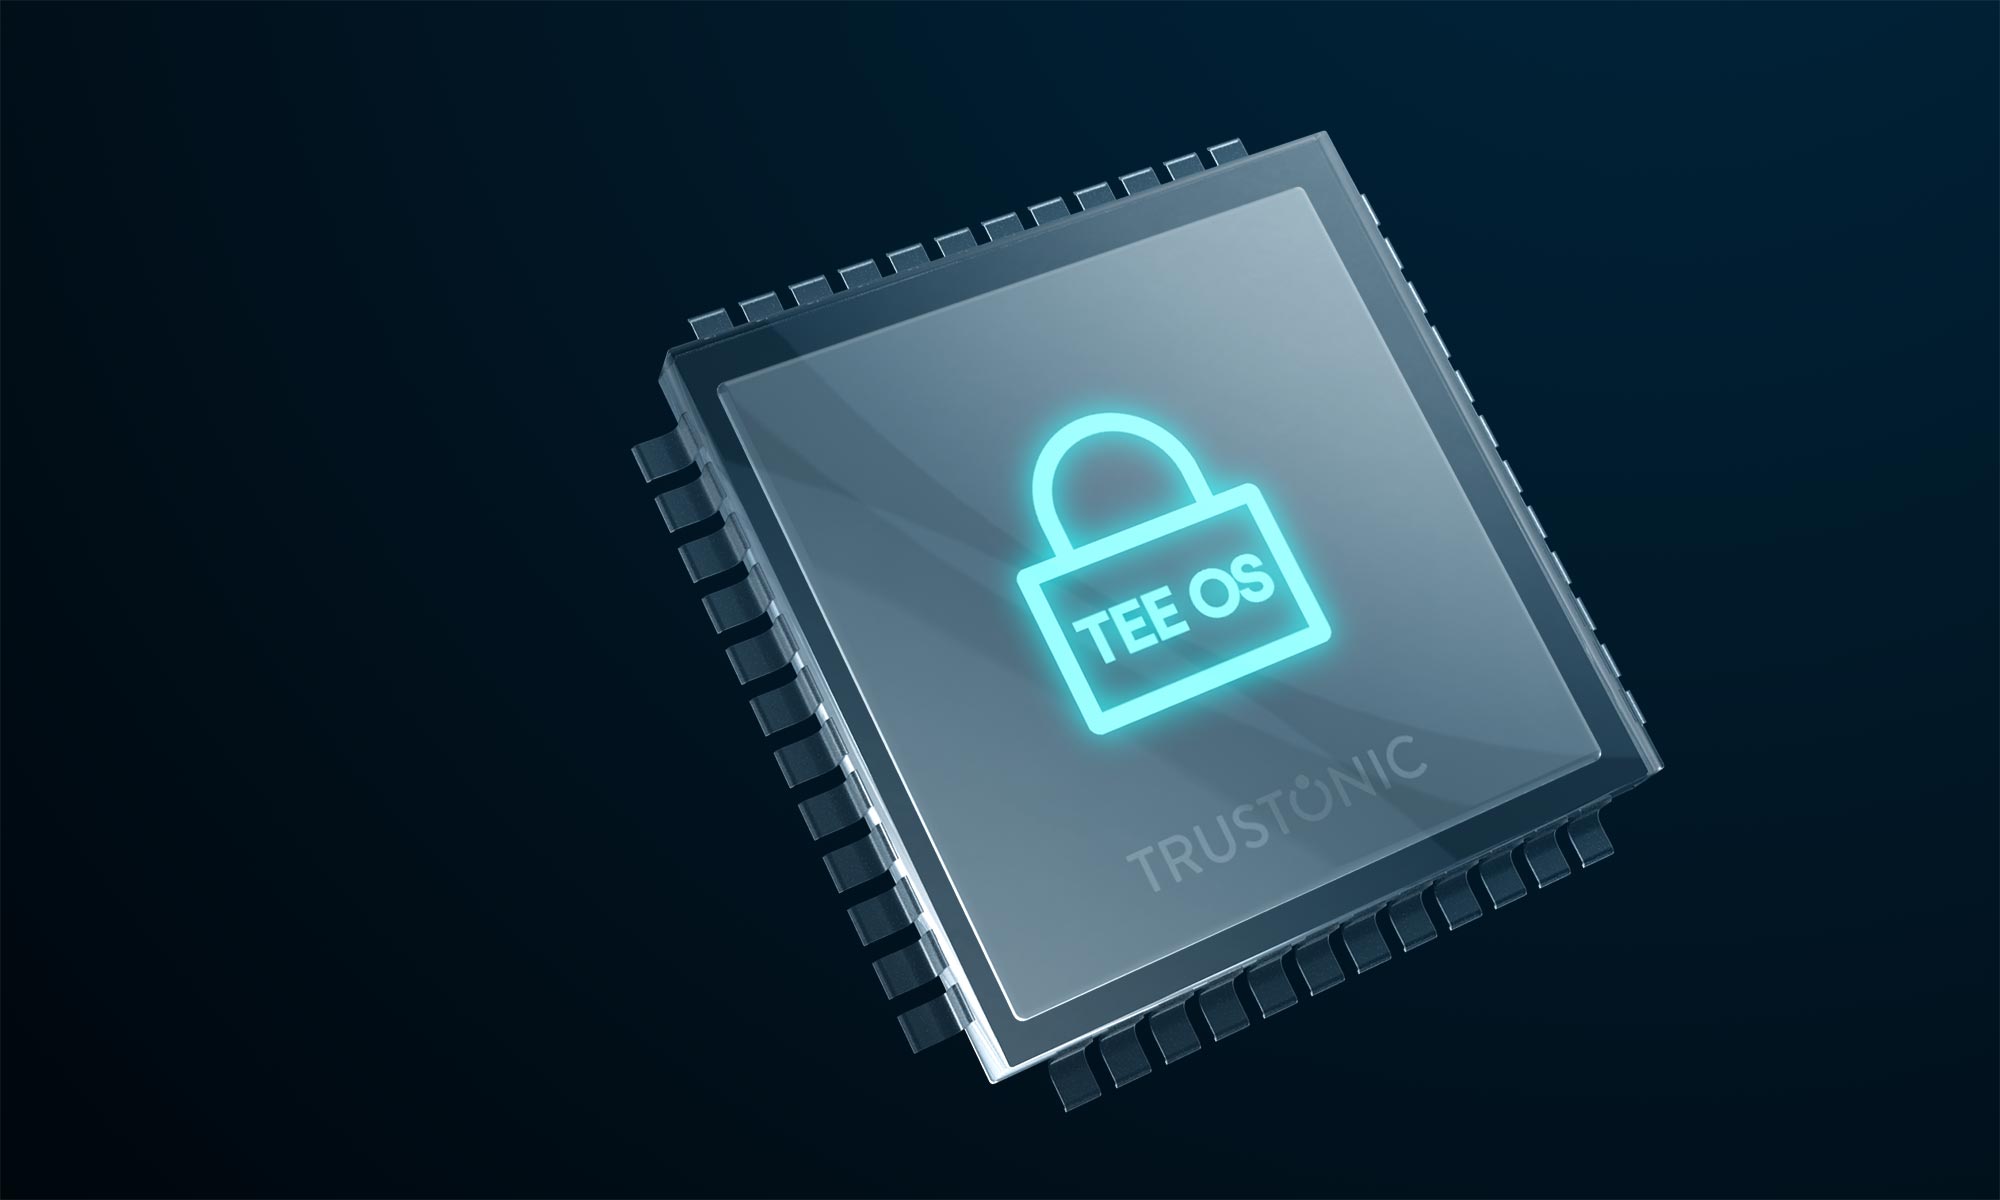
A Trusted Execution Environment (TEE) is an environment where the code executed and the data accessed is isolated and protected in terms of confidentiality (no one have access to the data) and integrity (no one can change the code and its behavior). We may not be aware, but a lot of devices around us make […]

Container technology in general and Linux containers, in particular, have become increasingly popular in recent years. The use of containers in data centers and cloud computing environments is growing every year and tools like Docker and Kubernetes have become quite popular. And it’s no different in the world of embedded Linux since some container-based Linux […]